Verisk's latest Quarterly Property Report examines vast market price data from third-party outlets and synthesizes the results into a comprehensive report to give property insurers a detailed overview of key elements affecting property expenses, encompassing labor and materials, reconstruction, claims, and relevant economic trends in the United States and Canada. We also review our internal claims data to identify trends, outliers, and comparisons with prior years.

Claim assignment volume
The Property Report, reporting on Q2 2024 data, reveals accelerating costs and significant regional variations. Claim assignment volume has stabilized compared to Q2 2023, with wind and hail losses dominating the landscape, accounting for 57% of all assignments.
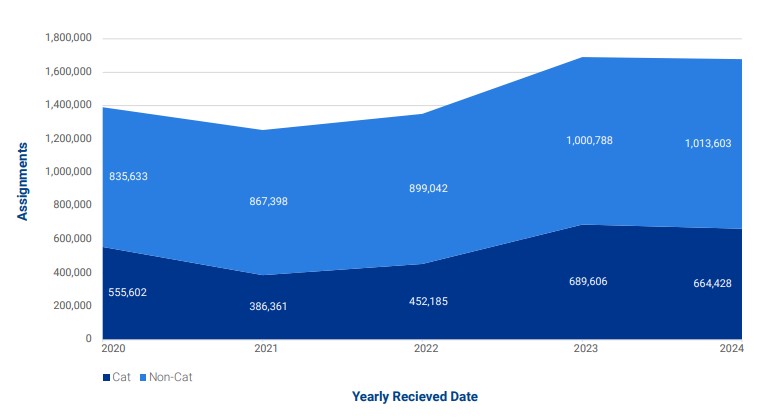
Q2 assignment volume by year and cat status
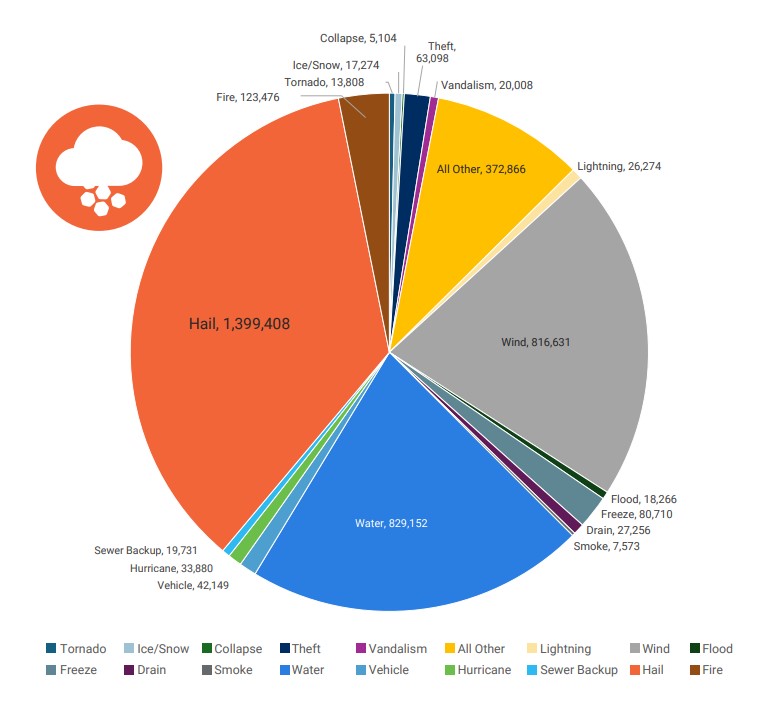
Assignments Count by type of loss
Elevated claim volume in Texas
Texas emerged as a regional hotspot for wind and hail claims, experiencing a 45% increase in those assignments compared to Q2 2023. The impact was particularly pronounced in urban areas, with roof replacement costs jumping 7.5% in Dallas/Fort Worth and 9.7% in Sherman.
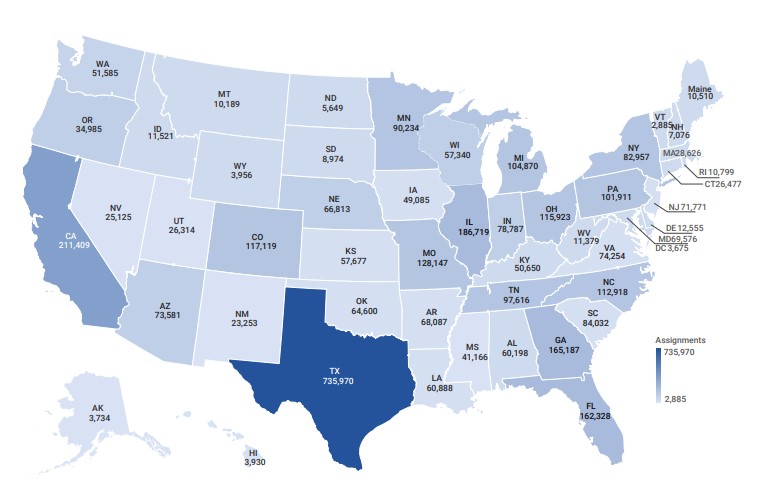
Number of assignments by state
Labor and material cost changes
Labor and material costs rose across the board. Notably, concrete mason costs surged 9.36% in the U.S. and 5.79% in Canada. Material costs in the U.S. increased 1.75% from January to July 2024, already surpassing the total increase for all of 2023.
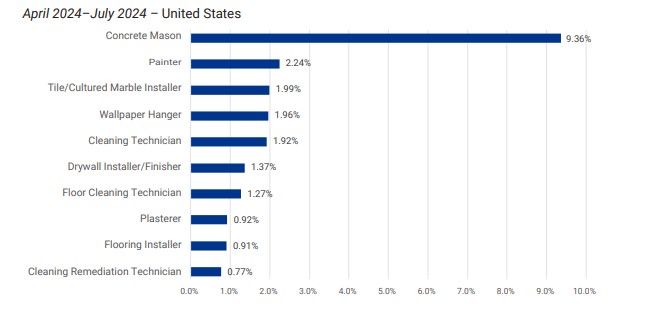
Top 10 Trades by Retail Labor % Change – U.S.
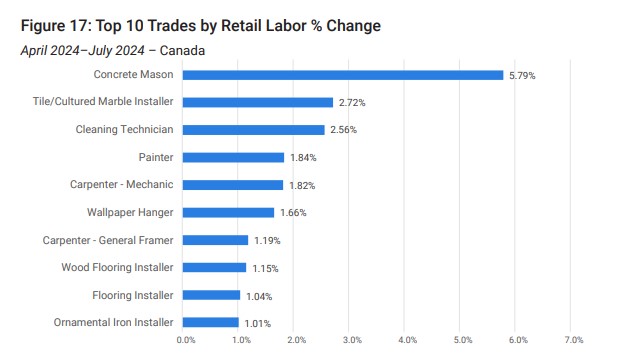
Top 10 Trades by Retail Labor % Change – Canada
Fuel cost changes
Fuel costs presented a mixed trend, showing an overall quarterly decrease, but a recent uptick that suggests a potential reversal of the trend. Significant regional variations persist, with up to $1.17/gallon difference observed across U.S. regions
For a detailed analysis of these trends and their implications for the property insurance and restoration industry, download the full Verisk Quarterly Property Report. Download now